Features
1. Determine future energy use when planning changes in the business.
2. Draw energy consumption trends (hourly, weekly, daily, monthly, seasonal, operational…)
3. Diagnose specific areas of wasted energy.
4. Manage the production per minute and unit/Kg.
5. Manage their energy consumption for each m/c, rather than accept it as a fixed cost that they have no control over.
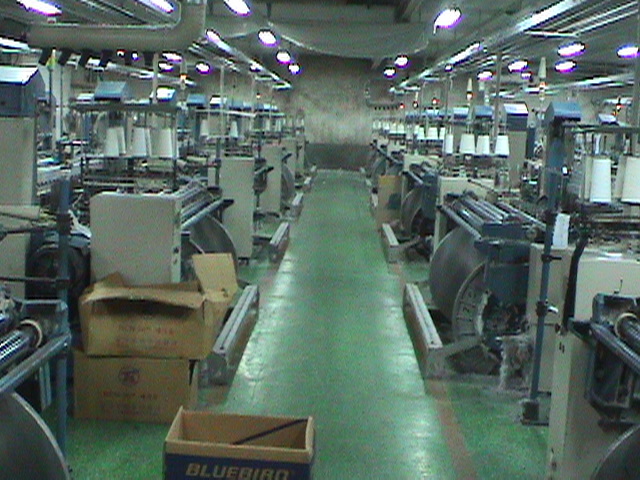
SCADA System
The energy monitoring system implemented in J. P. Plant. The two comports of SCADA PC are used for Energy meter & VFD communication. The 7 energy meters from different m/c are connected to SCADA PC through RS485 /232 converter & the 5 VFD’s from different m/c are connected to SCADA PC through PLC (HMI) with RS485/232 converters. All data is collect in PC for hourly , daily , monthly calculation of energy consumption, production/min, unit/Kg.
Reporting
Hourly report for energy consumption, production/hr, unit/kg for each machine.
Daily, Shift wise report for the same.
Daily average report for the energy consumption, production and unit/kg .
Historical Analysis of the logged data.

CONFIGURATION: PLC: FX2N 64 MR
HMI: E200
SCADA: Ellipse 2.29
CUSTOMER : J. P. Plant